-
Shadow Colour for SketchUp®
-
Shadow Colour for Autodesk® Revit®
-
Planary for Autodesk® Revit®
-
Planary for Autodesk® AutoCAD®
-
Plan Match for Autodesk® Revit®
-
- Articles coming soon
-
-
Account Management
-
Changelog
Site Analysis
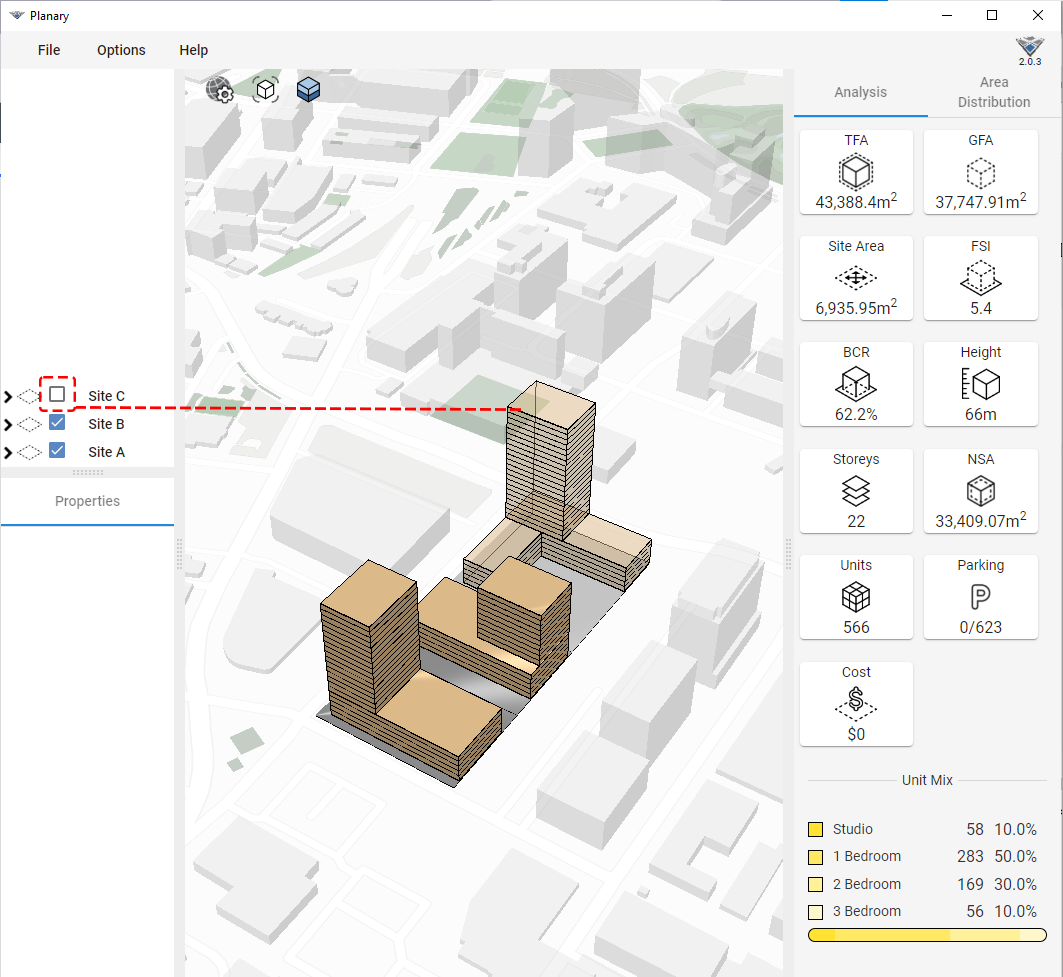
The Analysis Dashboard
The analysis dashboard allows you to track the site and building statistics in real time.
TFA – Total Floor Area – The total floor area within the building, measured to the external face of the external walls.

GFA – Gross Floor Area – The total floor area multiplied by the efficiency factor(configurable).

Site Area – The total area of the site within the site boundaries.

FSI – Floor Space Index. Also referred to as FAR (Floor Area Ratio) is the ratio of the total floor area (GFA) to site area.

BCR – Building Coverage Ratio – The ratio of the building total first-floor area (footprint) divided by the site area.

Height – The height of the highest building in the project.

Storeys – The number of storeys of the highest building in the project.

NSA – Net Saleable Area – The amount of space for sale extracted from the total floor area, calculated by the sell efficiency factor(configurable).

Units – Total unit count – NSA divided by average unit size.

Parking – Total required and provided parking spots, calculated by parking/units ratio, and parking per m2 / ft2.

Cost – High-level cost estimation calculated by cost per m2 / ft2.

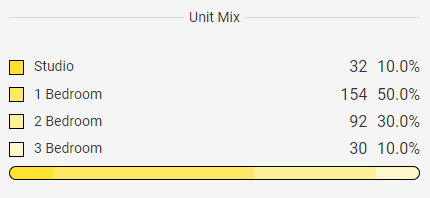
Unit Mix
The number of different residential units in the project by types.
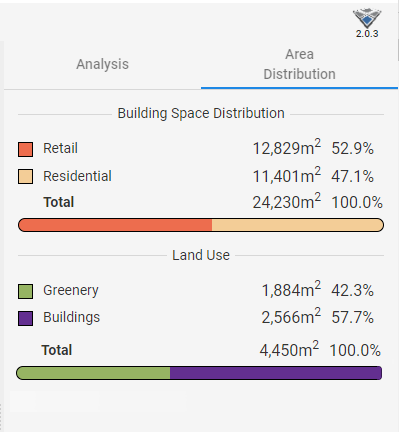
Area distribution
To see the total areas and ratios of building spaces and land use, go to the Analysis dashboard > Area distribution tab.
Real-Time Analysis
In Planary, you can continue work and edit the po9lylines in AutoCAD and the statistics will update accordingly.
At anytime, you can exclude any element (such as Site, Building or Building Part) from the statistics by unchecking the element from the project browser.